
-

- CMU Weather CONUS Model Viewer
- |
-
GFS
-
NAM
-
RAP
-
HRRR
- |
-
NWS Graphical Forecasts
-
KMOP Meteograms
Hover over one of the above models/forecasts and select a plot to show
Copyright Kyle Gillett, cmuweather.com – 2020.
The data on this page is for educational purposes and is not intended to influnce life-threatening sistuation decision making.
Data on this page is Courtesy of NOAA, grADs, NWS GRR and DTX, and Iowa State University.
For questions and comments on this page, please email us at cmuweather@gmail.com or message us through twitter, @cmuweather.
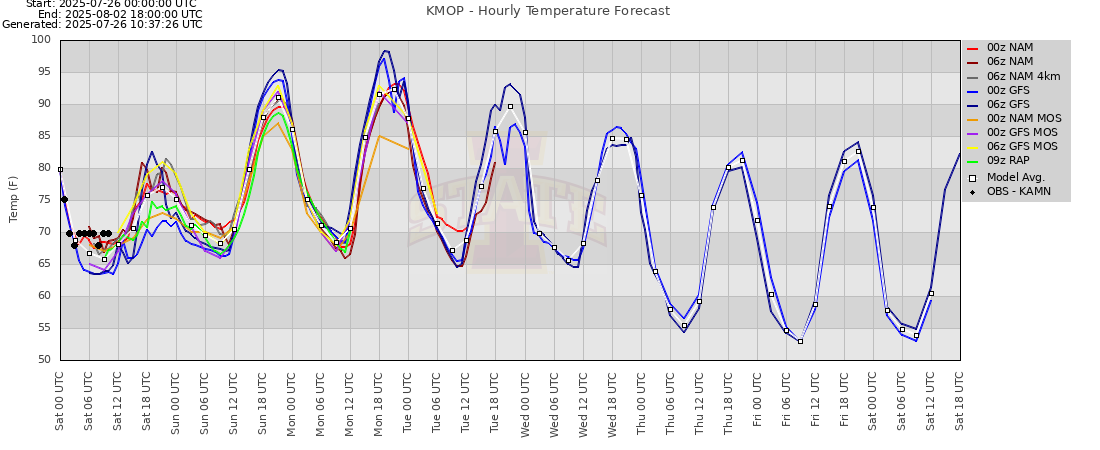
Iowa State University 7 Day Meteograms
KMOP – Temperature
Copyright Kyle Gillett, cmuweather.com – 2020.
The data on this page is for educational purposes and is not intended to influnce life-threatening sistuation decision making.
Data on this page is Courtesy of NOAA, grADs, NWS GRR and DTX, and Iowa State University.
For questions and comments on this page, please email us at cmuweather@gmail.com or message us through twitter, @cmuweather.
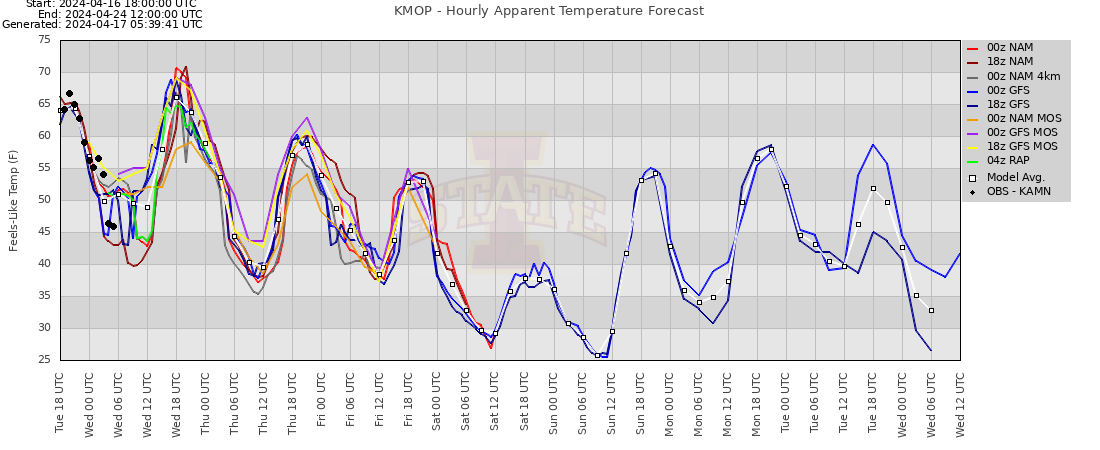
Iowa State University 7 Day Meteograms
KGRR – Apparent Temperature
Copyright Kyle Gillett, cmuweather.com – 2020.
The data on this page is for educational purposes and is not intended to influnce life-threatening sistuation decision making.
Data on this page is Courtesy of NOAA, grADs, NWS GRR and DTX, and Iowa State University.
For questions and comments on this page, please email us at cmuweather@gmail.com or message us through twitter, @cmuweather.
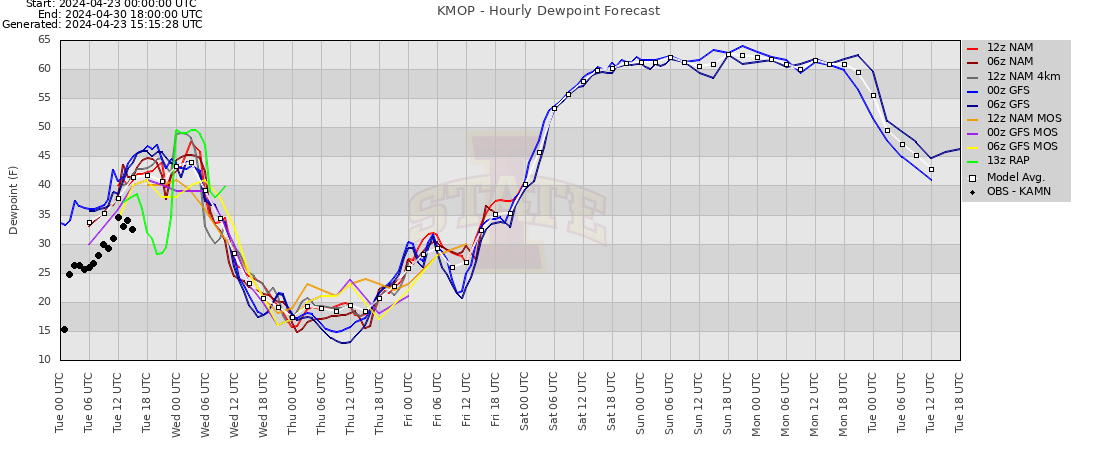
Iowa State University 7 Day Meteograms
KMOP – Dewpoint
Copyright Kyle Gillett, cmuweather.com – 2020.
The data on this page is for educational purposes and is not intended to influnce life-threatening sistuation decision making.
Data on this page is Courtesy of NOAA, grADs, NWS GRR and DTX, and Iowa State University.
For questions and comments on this page, please email us at cmuweather@gmail.com or message us through twitter, @cmuweather.
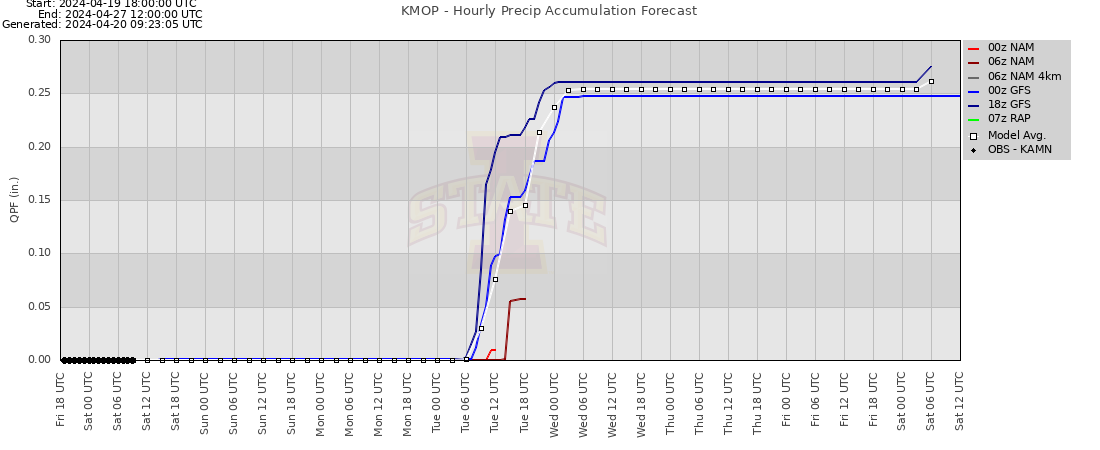
Iowa State University 7 Day Meteograms
KMOP – Total Precip Accumulation
Copyright Kyle Gillett, cmuweather.com – 2020.
The data on this page is for educational purposes and is not intended to influnce life-threatening sistuation decision making.
Data on this page is Courtesy of NOAA, grADs, NWS GRR and DTX, and Iowa State University.
For questions and comments on this page, please email us at cmuweather@gmail.com or message us through twitter, @cmuweather.
Iowa State University 7 Day Meteograms
KMOP – Total Accumulating Snowfall
Copyright Kyle Gillett, cmuweather.com – 2020.
The data on this page is for educational purposes and is not intended to influnce life-threatening sistuation decision making.
Data on this page is Courtesy of NOAA, grADs, NWS GRR and DTX, and Iowa State University.
For questions and comments on this page, please email us at cmuweather@gmail.com or message us through twitter, @cmuweather.
Iowa State University 7 Day Meteograms
KMOP – Total Sleet Accumulation
Copyright Kyle Gillett, cmuweather.com – 2020.
The data on this page is for educational purposes and is not intended to influnce life-threatening sistuation decision making.
Data on this page is Courtesy of NOAA, grADs, NWS GRR and DTX, and Iowa State University.
For questions and comments on this page, please email us at cmuweather@gmail.com or message us through twitter, @cmuweather.
Iowa State University 7 Day Meteograms
KMOP – Total Freezing Rain Accumulation

Copyright Kyle Gillett, cmuweather.com – 2020.
The data on this page is for educational purposes and is not intended to influnce life-threatening sistuation decision making.
Data on this page is Courtesy of NOAA, grADs, NWS GRR and DTX, and Iowa State University.
For questions and comments on this page, please email us at cmuweather@gmail.com or message us through twitter, @cmuweather.
Iowa State University 7 Day Meteograms
KMOP – Wind Speed
Copyright Kyle Gillett, cmuweather.com – 2020.
The data on this page is for educational purposes and is not intended to influnce life-threatening sistuation decision making.
Data on this page is Courtesy of NOAA, grADs, NWS GRR and DTX, and Iowa State University.
For questions and comments on this page, please email us at cmuweather@gmail.com or message us through twitter, @cmuweather.
Iowa State University 7 Day Meteograms
KMOP – Wind Direction

Copyright Kyle Gillett, cmuweather.com – 2020.
The data on this page is for educational purposes and is not intended to influnce life-threatening sistuation decision making.
Data on this page is Courtesy of NOAA, grADs, NWS GRR and DTX, and Iowa State University.
For questions and comments on this page, please email us at cmuweather@gmail.com or message us through twitter, @cmuweather.
Most Recent National Weather Service Graphical Forecasts
KMOP – Mount Pleasant Hourly Forecast
Copyright Kyle Gillett, cmuweather.com – 2020.
The data on this page is for educational purposes and is not intended to influnce life-threatening sistuation decision making.
Data on this page is Courtesy of NOAA, grADs, NWS GRR and DTX, and Iowa State University.
For questions and comments on this page, please email us at cmuweather@gmail.com or message us through twitter, @cmuweather.
Most Recent National Weather Service Graphical Forecasts
KGRR – Grand Rapids Hourly Forecast
Copyright Kyle Gillett, cmuweather.com – 2020.
The data on this page is for educational purposes and is not intended to influnce life-threatening sistuation decision making.
Data on this page is Courtesy of NOAA, grADs, NWS GRR and DTX, and Iowa State University.
For questions and comments on this page, please email us at cmuweather@gmail.com or message us through twitter, @cmuweather.
Most Recent National Weather Service Graphical Forecasts
KLAN – Lansing Hourly Forecast
Copyright Kyle Gillett, cmuweather.com – 2020.
The data on this page is for educational purposes and is not intended to influnce life-threatening sistuation decision making.
Data on this page is Courtesy of NOAA, grADs, NWS GRR and DTX, and Iowa State University.
For questions and comments on this page, please email us at cmuweather@gmail.com or message us through twitter, @cmuweather.
Most Recent National Weather Service Graphical Forecasts
KAZO – Kalamazoo Hourly Forecast
Copyright Kyle Gillett, cmuweather.com – 2020.
The data on this page is for educational purposes and is not intended to influnce life-threatening sistuation decision making.
Data on this page is Courtesy of NOAA, grADs, NWS GRR and DTX, and Iowa State University.
For questions and comments on this page, please email us at cmuweather@gmail.com or message us through twitter, @cmuweather.
Most Recent National Weather Service Graphical Forecasts
KJXN – Jackson Hourly Forecast
Copyright Kyle Gillett, cmuweather.com – 2020.
The data on this page is for educational purposes and is not intended to influnce life-threatening sistuation decision making.
Data on this page is Courtesy of NOAA, grADs, NWS GRR and DTX, and Iowa State University.
For questions and comments on this page, please email us at cmuweather@gmail.com or message us through twitter, @cmuweather.
Most Recent National Weather Service Graphical Forecasts
KFNT – Flint Hourly Forecast
Copyright Kyle Gillett, cmuweather.com – 2020.
The data on this page is for educational purposes and is not intended to influnce life-threatening sistuation decision making.
Data on this page is Courtesy of NOAA, grADs, NWS GRR and DTX, and Iowa State University.
For questions and comments on this page, please email us at cmuweather@gmail.com or message us through twitter, @cmuweather.
Most Recent National Weather Service Graphical Forecasts
KHYX – Saginaw Hourly Forecast
Copyright Kyle Gillett, cmuweather.com – 2020.
The data on this page is for educational purposes and is not intended to influnce life-threatening sistuation decision making.
Data on this page is Courtesy of NOAA, grADs, NWS GRR and DTX, and Iowa State University.
For questions and comments on this page, please email us at cmuweather@gmail.com or message us through twitter, @cmuweather.
Most Recent National Weather Service Graphical Forecasts
KARB – Ann Arbor Hourly Forecast
Copyright Kyle Gillett, cmuweather.com – 2020.
The data on this page is for educational purposes and is not intended to influnce life-threatening sistuation decision making.
Data on this page is Courtesy of NOAA, grADs, NWS GRR and DTX, and Iowa State University.
For questions and comments on this page, please email us at cmuweather@gmail.com or message us through twitter, @cmuweather.
Most Recent National Weather Service Graphical Forecasts
KDET – Detroit Hourly Forecast
Copyright Kyle Gillett, cmuweather.com – 2020.
The data on this page is for educational purposes and is not intended to influnce life-threatening sistuation decision making.
Data on this page is Courtesy of NOAA, grADs, NWS GRR and DTX, and Iowa State University.
For questions and comments on this page, please email us at cmuweather@gmail.com or message us through twitter, @cmuweather.
Most Recent National Weather Service Graphical Forecasts
KGLR – Gaylord Hourly Forecast
Copyright Kyle Gillett, cmuweather.com – 2020.
The data on this page is for educational purposes and is not intended to influnce life-threatening sistuation decision making.
Data on this page is Courtesy of NOAA, grADs, NWS GRR and DTX, and Iowa State University.
For questions and comments on this page, please email us at cmuweather@gmail.com or message us through twitter, @cmuweather.
Most Recent National Weather Service Graphical Forecasts
KTVC – Traverse City Hourly Forecast
Copyright Kyle Gillett, cmuweather.com – 2020.
The data on this page is for educational purposes and is not intended to influnce life-threatening sistuation decision making.
Data on this page is Courtesy of NOAA, grADs, NWS GRR and DTX, and Iowa State University.
For questions and comments on this page, please email us at cmuweather@gmail.com or message us through twitter, @cmuweather.
Most Recent National Weather Service Graphical Forecasts
KMCD – Mackinaw City Hourly Forecast
Copyright Kyle Gillett, cmuweather.com – 2020.
The data on this page is for educational purposes and is not intended to influnce life-threatening sistuation decision making.
Data on this page is Courtesy of NOAA, grADs, NWS GRR and DTX, and Iowa State University.
For questions and comments on this page, please email us at cmuweather@gmail.com or message us through twitter, @cmuweather.
CONUS Sector – G
lobal F
orecast S
ystem – GFS – 240hr GIF Loop
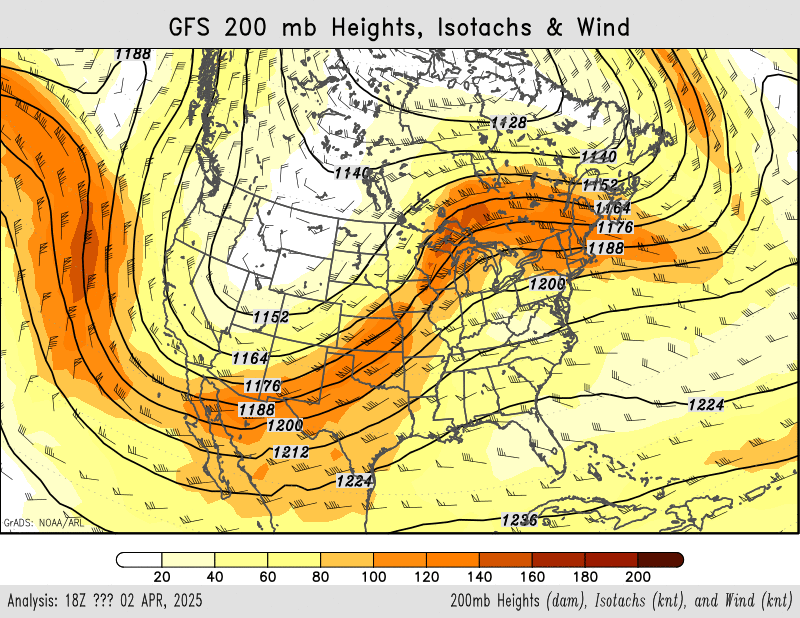
GFS 200mb Heights (dam), Isotachs (knt) and Wind (knt)
Product Description
- Isopleths as black lines expressing the height of the 200 mb level in decameters (dam).
- Wind magnitude in knots at 200 mb expressed as color fill. Fill begins at wind magnitude => 40 knots; color bar on the bottom of the image for wind magnitudes of 10 to 200 knots in 20 knot increments.
- Wind in knots at 200 mb expressed as wind barbs.
Copyright Kyle Gillett, cmuweather.com – 2020.
The data on this page is for educational purposes and is not intended to influnce life-threatening sistuation decision making.
Data on this page is Courtesy of NOAA, grADs, NWS GRR and DTX, and Iowa State University.
For questions and comments on this page, please email us at cmuweather@gmail.com or message us through twitter, @cmuweather.
CONUS Sector – G
lobal F
orecast S
ystem – GFS – 240hr GIF Loop
GFS 500mb Heights (dam) Wind (knts) and Vorticity (1e-5/sec)
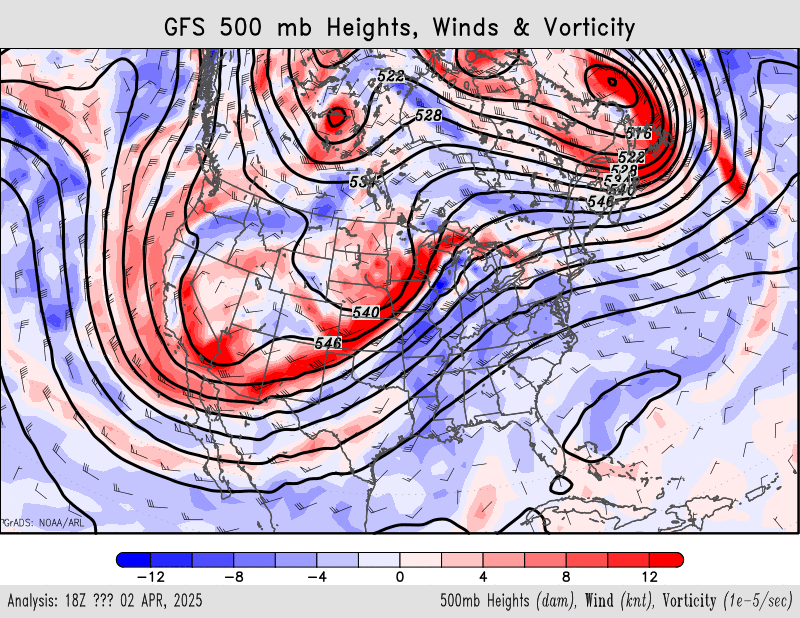
Product Description
- Absolute Vorticity (10**(-5)/second) at 500 mb expressed as color fill with a color bar on the bottom of the image.
- Isopleths as black lines expressing the height of the 500 mb level in decameters (dam).
- Wind in knots at 500 mb expressed as wind barbs.
Copyright Kyle Gillett, cmuweather.com – 2020.
The data on this page is for educational purposes and is not intended to influnce life-threatening sistuation decision making.
Data on this page is Courtesy of NOAA, grADs, NWS GRR and DTX, and Iowa State University.
For questions and comments on this page, please email us at cmuweather@gmail.com or message us through twitter, @cmuweather.
CONUS Sector – G
lobal F
orecast S
ystem – GFS – 240hr GIF Loop
GFS 700mb Heights (dam), Vertical Velocity (mb/hr), Relative Humidity (%) and Wind (knt)
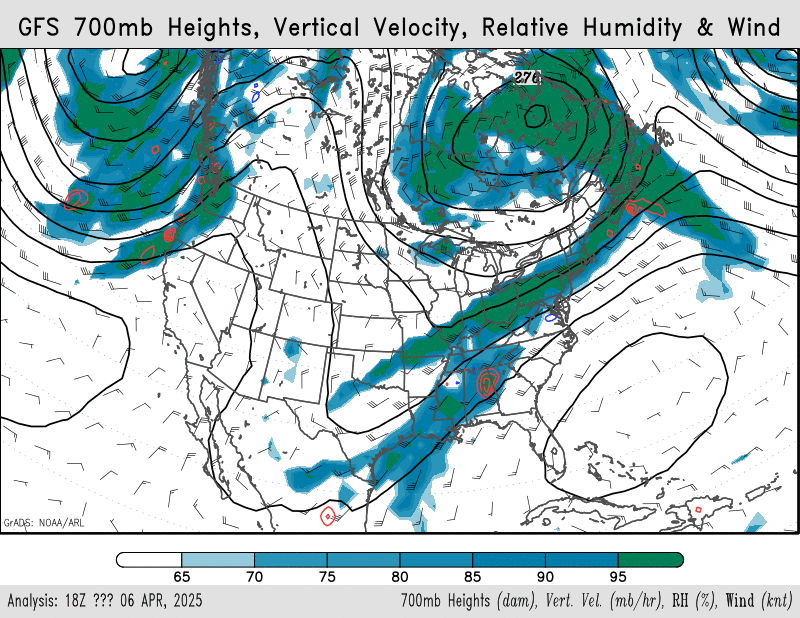
Product Description
- Relative humidity at 700 mb as a percentage (%). Fill begins at percentages at >= 60%.
- Isopleths as black lines expressing the height of the 700 mb level in decameters (dam).
- Wind in knots (knt) at 700 mb expressed as wind barbs.
Copyright Kyle Gillett, cmuweather.com – 2020.
The data on this page is for educational purposes and is not intended to influnce life-threatening sistuation decision making.
Data on this page is Courtesy of NOAA, grADs, NWS GRR and DTX, and Iowa State University.
For questions and comments on this page, please email us at cmuweather@gmail.com or message us through twitter, @cmuweather.
CONUS Sector – G
lobal F
orecast S
ystem – GFS – 240hr GIF Loop
GFS 850mb Temperature (F), Relative Humidity (%) and Wind (knt)
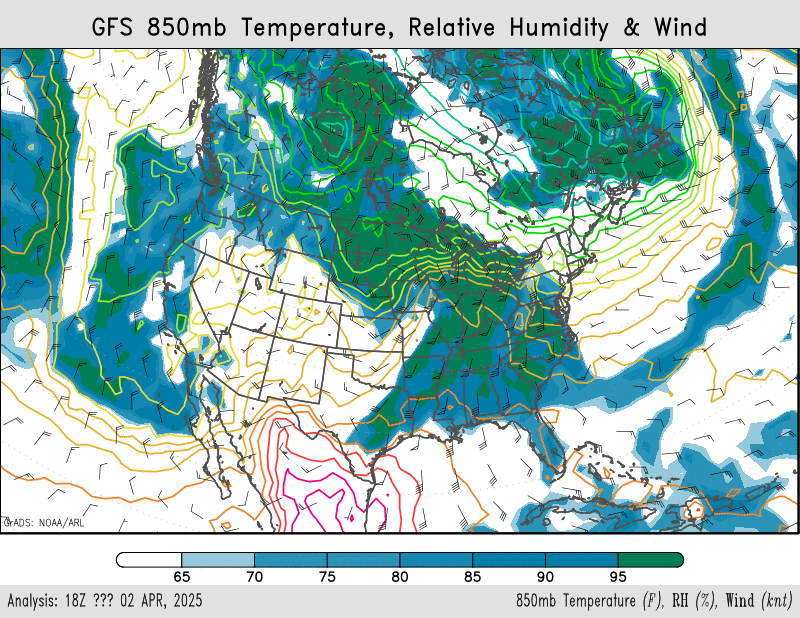
Product Description
- Relative humidity at 850 mb as a percentage (%). Fill begins at percentages at >= 60%.
- Isopleths as black lines expressing the height of the 850 mb level in decameters (dam).
- Isotherms as various color expressing temperature in degrees fahrenheit (F) at the 850 mb level
- Wind in knots (knt) at 850 mb expressed as wind barbs.
Copyright Kyle Gillett, cmuweather.com – 2020.
The data on this page is for educational purposes and is not intended to influnce life-threatening sistuation decision making.
Data on this page is Courtesy of NOAA, grADs, NWS GRR and DTX, and Iowa State University.
For questions and comments on this page, please email us at cmuweather@gmail.com or message us through twitter, @cmuweather.
CONUS Sector – G
lobal F
orecast S
ystem – GFS – 240hr GIF Loop
GFS MSLP (SLP(mb-100)), 1000-500mb Thickness (dam) and 6hr Precipitation (mm)
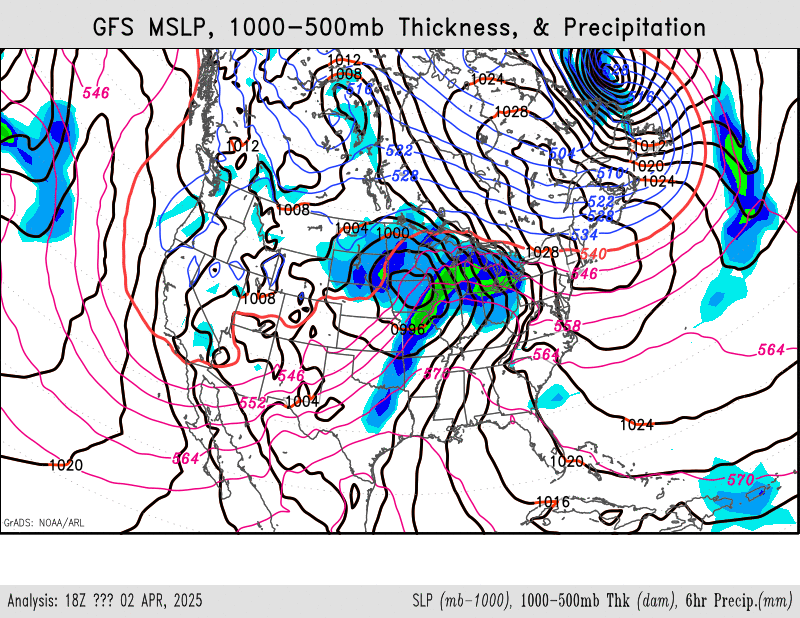
Product Description
- The thickness of the 1000 mb to 500 mb layer expressed in decameters (dam). Increments are 6 dam apart. For thicknesses of 546 dam and greater, these contours will be red dashed lines. For values below 546 dam the dashed lines will be in blue. The 540 dam line provides a very rough indication of possible frozen precipitation depending on surface temperature and other conditions.
- Accumulated precipitation in inches for the 6 hours preceding the forecast hour expressed as color fill for values >= 0.01. A reference bar of values for each color is located on the top right of the image.
- Isobars as black lines expressing Mean Sea Level Pressure in millibars (mb).
Copyright Kyle Gillett, cmuweather.com – 2020.
The data on this page is for educational purposes and is not intended to influnce life-threatening sistuation decision making.
Data on this page is Courtesy of NOAA, grADs, NWS GRR and DTX, and Iowa State University.
For questions and comments on this page, please email us at cmuweather@gmail.com or message us through twitter, @cmuweather.
CONUS Sector – G
lobal F
orecast S
ystem – GFS – 240hr GIF Loop
GFS 2m Temperature (F) and 10m Wind (knt)
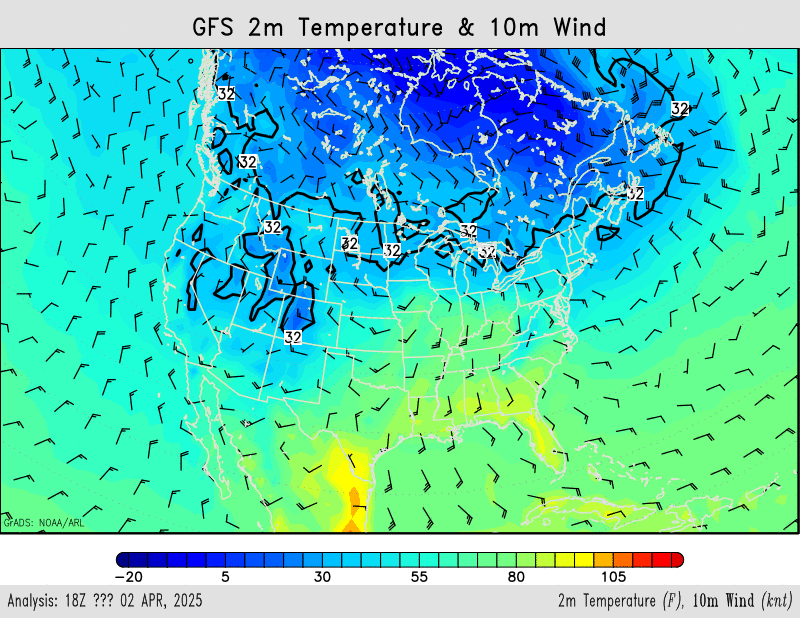
Product Description
- 2m Temperature expressed as color fill for values >= -40 in degrees fahrenheit (F)
- 10m wind speeds expressed as wind barbs.
Copyright Kyle Gillett, cmuweather.com – 2020.
The data on this page is for educational purposes and is not intended to influnce life-threatening sistuation decision making.
Data on this page is Courtesy of NOAA, grADs, NWS GRR and DTX, and Iowa State University.
For questions and comments on this page, please email us at cmuweather@gmail.com or message us through twitter, @cmuweather.
CONUS Sector – G
lobal F
orecast S
ystem – GFS – 240hr GIF Loop
GFS Total Cloud Cover (%)
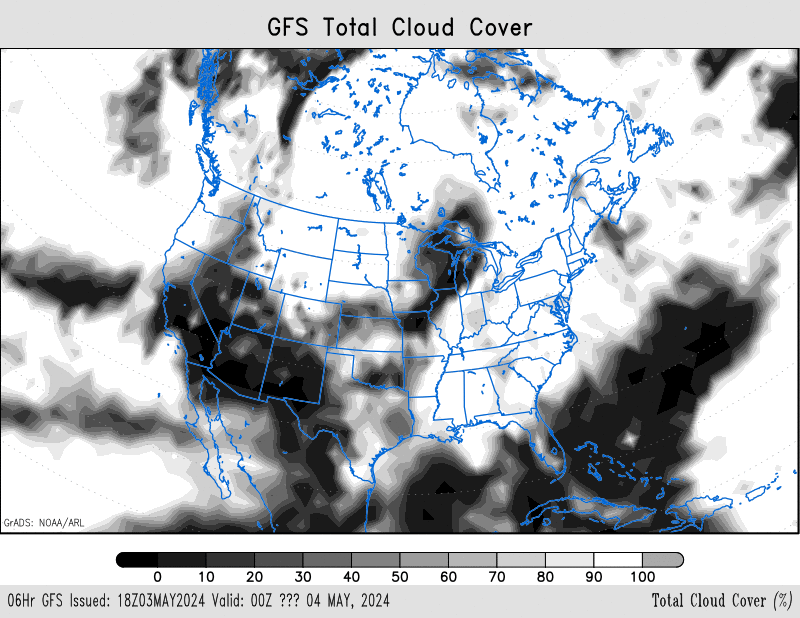
Product Description
- Simulated cloud cover expressed as white fill in pertentage (%).
Copyright Kyle Gillett, cmuweather.com – 2020.
The data on this page is for educational purposes and is not intended to influnce life-threatening sistuation decision making.
Data on this page is Courtesy of NOAA, grADs, NWS GRR and DTX, and Iowa State University.
For questions and comments on this page, please email us at cmuweather@gmail.com or message us through twitter, @cmuweather.
CONUS Sector – G
lobal F
orecast S
ystem – GFS – 240hr GIF Loop
GFS Convective Available Potential Energy (J/kg)
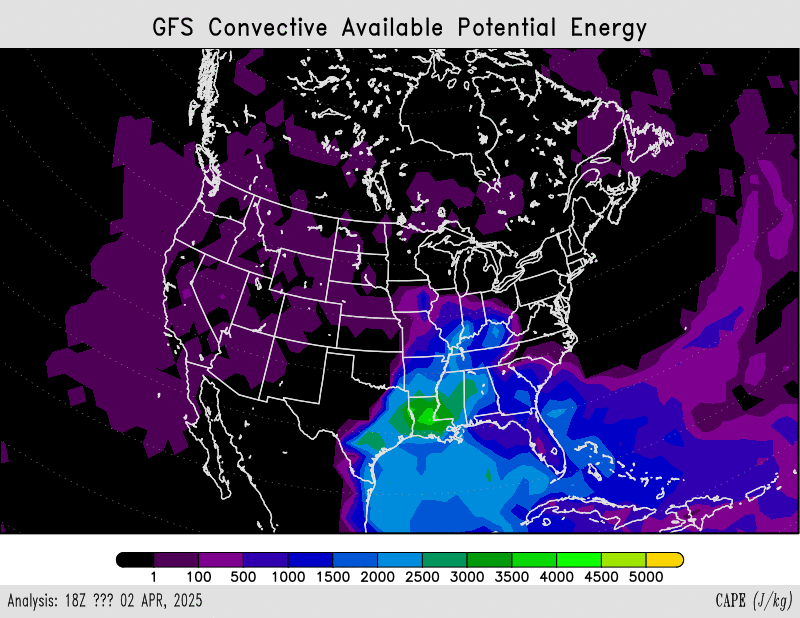
Product Description
- CAPE (Convective Available Potential Energy) is a measure of the energy of rising air parcels. The instability of the atmosphere depends upon this energy (joule per kilogram). A reference bar of values for each color (purple to yellow) is located on the bottom of the image.
Copyright Kyle Gillett, cmuweather.com – 2020.
The data on this page is for educational purposes and is not intended to influnce life-threatening sistuation decision making.
Data on this page is Courtesy of NOAA, grADs, NWS GRR and DTX, and Iowa State University.
For questions and comments on this page, please email us at cmuweather@gmail.com or message us through twitter, @cmuweather.
CONUS Sector – G
lobal F
orecast S
ystem – GFS – 240hr GIF Loop
GFS Standard Lift Index (C)
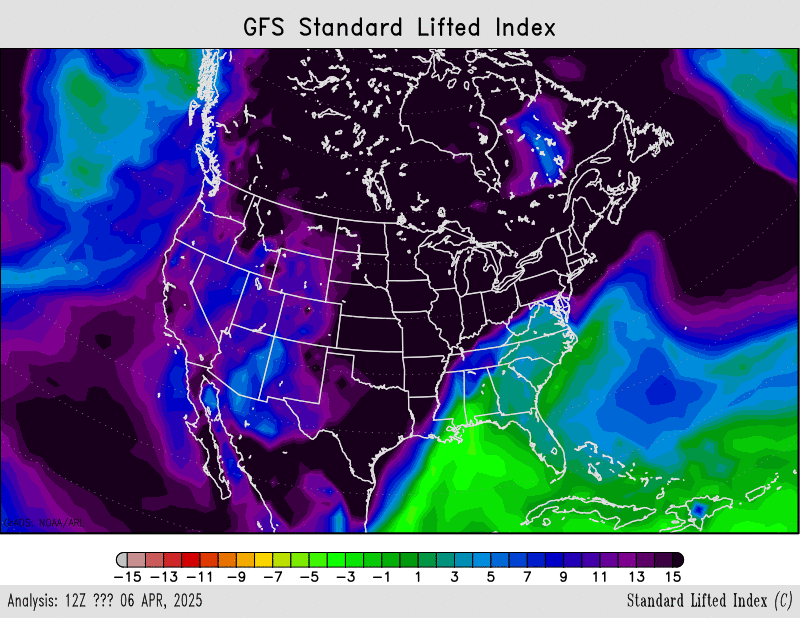
Product Description
- Lifted Index is the Lifted Index at 500-mb, based on the surface parcel, and the convective inhibition for the same parcel. These fields are meant to identify areas of surface-based CAPE and minimal convective inhibition, which suggests some threat for surface-based thunderstorms.
Copyright Kyle Gillett, cmuweather.com – 2020.
The data on this page is for educational purposes and is not intended to influnce life-threatening sistuation decision making.
Data on this page is Courtesy of NOAA, grADs, NWS GRR and DTX, and Iowa State University.
For questions and comments on this page, please email us at cmuweather@gmail.com or message us through twitter, @cmuweather.
CONUS Sector – N
orth A
merican M
esoscale Forecast System – NAM – 84hr GIF Loop
NAM 200mb Heights (dam), Isotachs (knt) and Wind (knt)
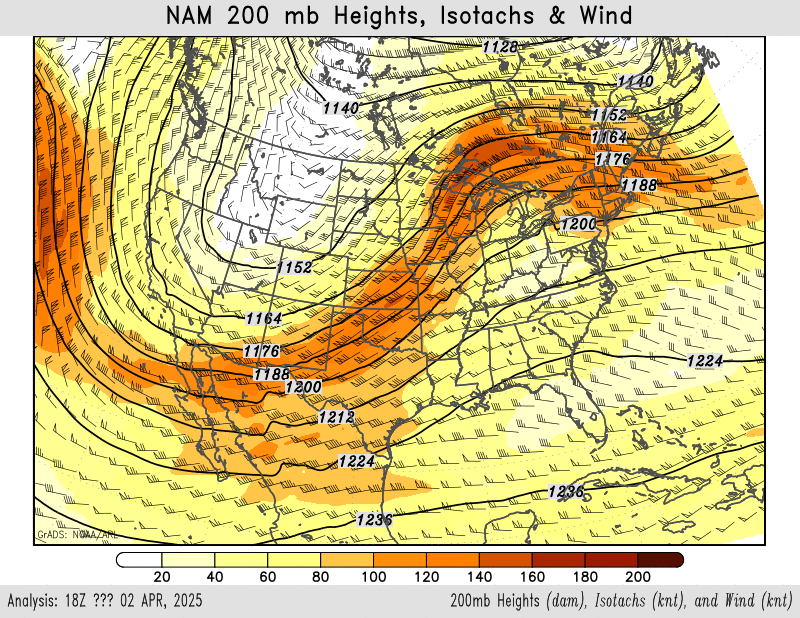
Product Description
- Isopleths as black lines expressing the height of the 200 mb level in decameters (dam).
- Wind magnitude in knots at 200 mb expressed as color fill. Fill begins at wind magnitude => 40 knots; color bar on the bottom of the image for wind magnitudes of 10 to 200 knots in 20 knot increments.
- Wind in knots at 200 mb expressed as wind barbs.
Copyright Kyle Gillett, cmuweather.com – 2020.
The data on this page is for educational purposes and is not intended to influnce life-threatening sistuation decision making.
Data on this page is Courtesy of NOAA, grADs, NWS GRR and DTX, and Iowa State University.
For questions and comments on this page, please email us at cmuweather@gmail.com or message us through twitter, @cmuweather.
CONUS Sector – N
orth A
merican M
esoscale Forecast System – NAM – 84hr GIF Loop
NAM 500mb Heights (dam) Wind (knts) and Vorticity (1e-5/sec)
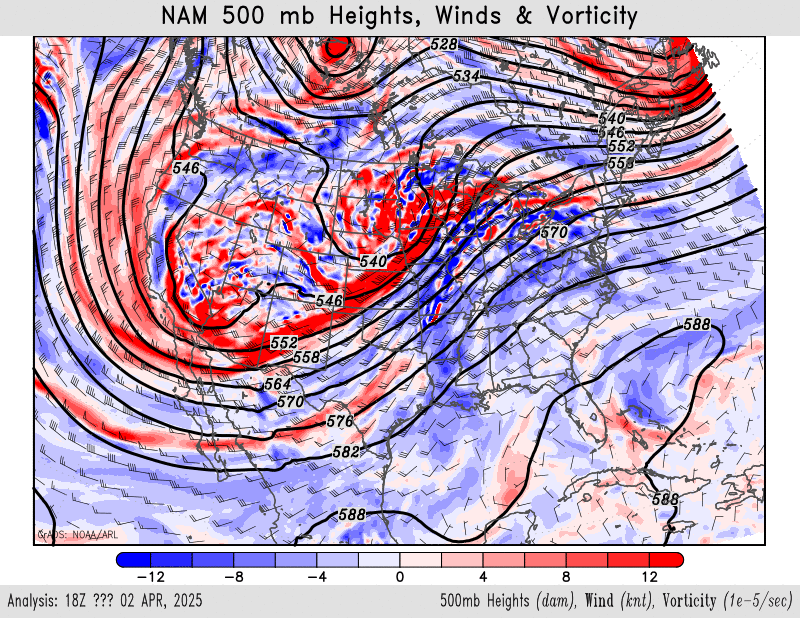
Product Description
- Absolute Vorticity (10**(-5)/second) at 500 mb expressed as color fill with a color bar on the bottom of the image.
- Isopleths as black lines expressing the height of the 500 mb level in decameters (dam).
- Wind in knots at 500 mb expressed as wind barbs.
Copyright Kyle Gillett, cmuweather.com – 2020.
The data on this page is for educational purposes and is not intended to influnce life-threatening sistuation decision making.
Data on this page is Courtesy of NOAA, grADs, NWS GRR and DTX, and Iowa State University.
For questions and comments on this page, please email us at cmuweather@gmail.com or message us through twitter, @cmuweather.
CONUS Sector – N
orth A
merican M
esoscale Forecast System – NAM – 84hr GIF Loop
NAM 700mb Heights (dam), Vertical Velocity (mb/hr), Relative Humidity (%) and Wind (knt)
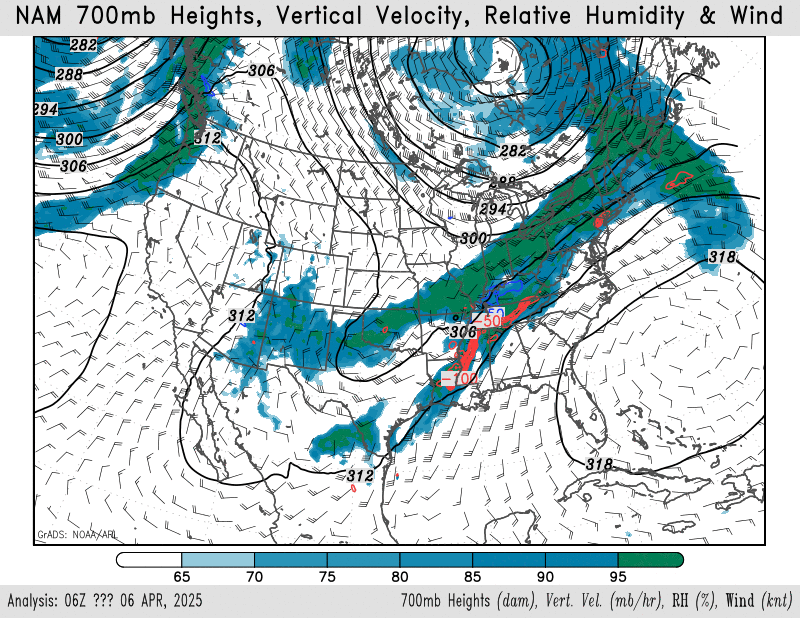
Product Description
- Relative humidity at 700 mb as a percentage. Fill begins at percentages at >= 60%.
- Isopleths as black lines expressing the height of the 700 mb level in decameters (dam).
- Wind in knots at 700 mb expressed as wind barbs.
Copyright Kyle Gillett, cmuweather.com – 2020.
The data on this page is for educational purposes and is not intended to influnce life-threatening sistuation decision making.
Data on this page is Courtesy of NOAA, grADs, NWS GRR and DTX, and Iowa State University.
For questions and comments on this page, please email us at cmuweather@gmail.com or message us through twitter, @cmuweather.
CONUS Sector – N
orth A
merican M
esoscale Forecast System – NAM – 84hr GIF Loop
NAM 850mb Temperature (F), Relative Humidity (%) and Wind (knt)
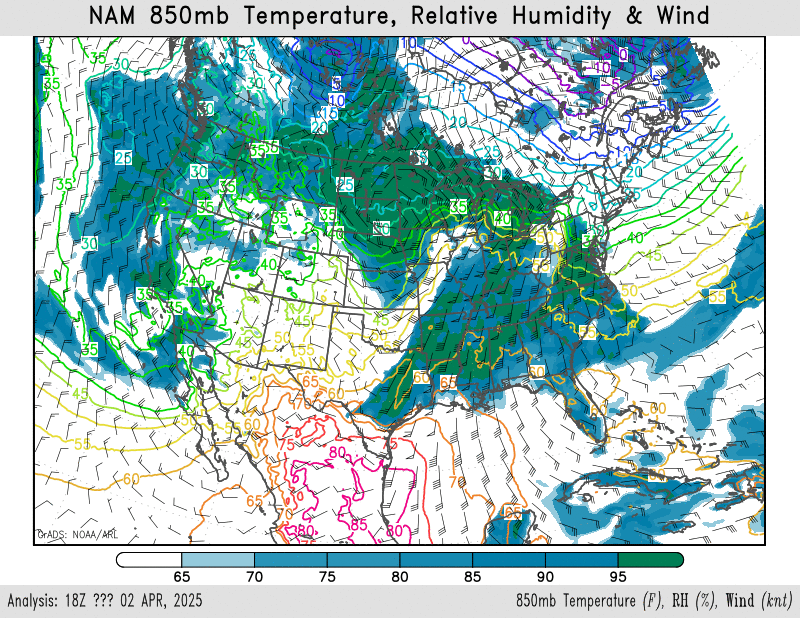
Product Description
- Relative humidity at 850 mb as a percentage (%). Fill begins at percentages at >= 60%.
- Isopleths as black lines expressing the height of the 850 mb level in decameters (dam).
- Isotherms as various color expressing temperature in degrees fahrenheit (F) at the 850 mb level
- Wind in knots (knt) at 850 mb expressed as wind barbs.
Copyright Kyle Gillett, cmuweather.com – 2020.
The data on this page is for educational purposes and is not intended to influnce life-threatening sistuation decision making.
Data on this page is Courtesy of NOAA, grADs, NWS GRR and DTX, and Iowa State University.
For questions and comments on this page, please email us at cmuweather@gmail.com or message us through twitter, @cmuweather.
CONUS Sector – N
orth A
merican M
esoscale Forecast System – NAM – 84hr GIF Loop
NAM MSLP (SLP(mb-100)), 1000-500mb Thickness (dam) and 6hr Precipitation (mm)
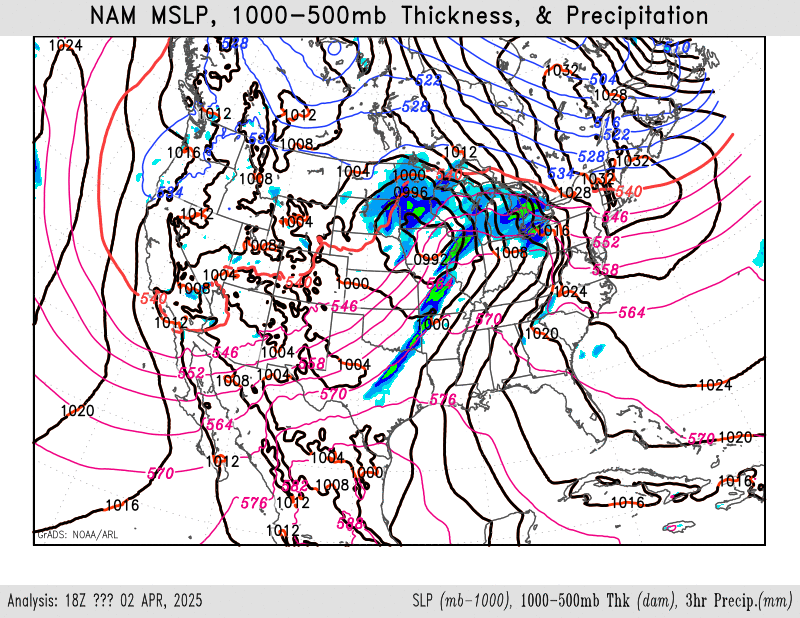
Product Description
- The thickness of the 1000 mb to 500 mb layer expressed in decameters (dam). Increments are 6 dam apart. For thicknesses of 546 dam and greater, these contours will be red dashed lines. For values below 546 dam the dashed lines will be in blue. The 540 dam line provides a very rough indication of possible frozen precipitation depending on surface temperature and other conditions.
- Accumulated precipitation in inches for the 6 hours preceding the forecast hour expressed as color fill for values >= 0.01. A reference bar of values for each color is located on the top right of the image.
- Isobars as black lines expressing Mean Sea Level Pressure in millibars (mb).
Copyright Kyle Gillett, cmuweather.com – 2020.
The data on this page is for educational purposes and is not intended to influnce life-threatening sistuation decision making.
Data on this page is Courtesy of NOAA, grADs, NWS GRR and DTX, and Iowa State University.
For questions and comments on this page, please email us at cmuweather@gmail.com or message us through twitter, @cmuweather.
CONUS Sector – N
orth A
merican M
esoscale Forecast System – NAM – 84hr GIF Loop
NAM 2m Temperature (F) and 10m Wind (knt)
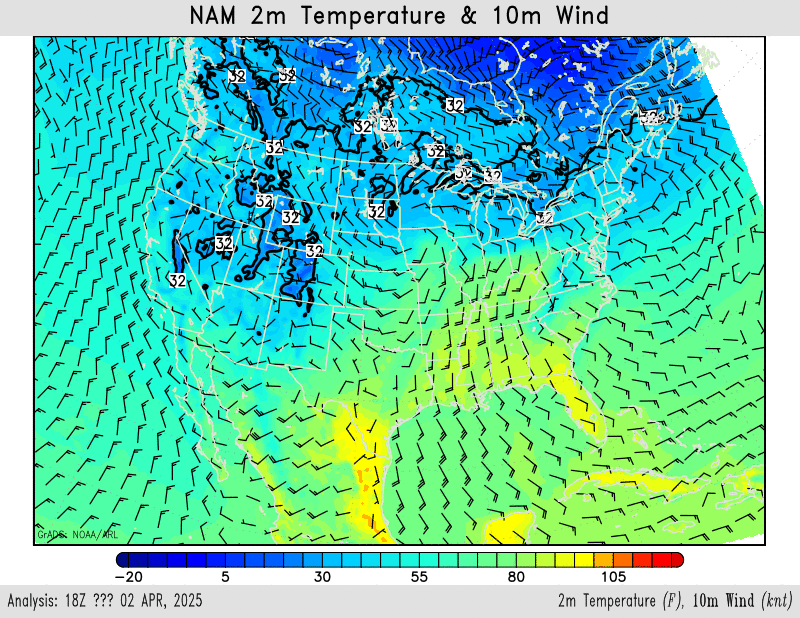
Product Description
- 2m Temperature expressed as color fill for values >= -40 in degrees fahrenheit (F)
- 10m wind speeds expressed as wind barbs.
Copyright Kyle Gillett, cmuweather.com – 2020.
The data on this page is for educational purposes and is not intended to influnce life-threatening sistuation decision making.
Data on this page is Courtesy of NOAA, grADs, NWS GRR and DTX, and Iowa State University.
For questions and comments on this page, please email us at cmuweather@gmail.com or message us through twitter, @cmuweather.
CONUS Sector – N
orth A
merican M
esoscale Forecast System – NAM – 84hr GIF Loop
NAM Precipitation Type – Categorial Snow/Rain/Ice Pellets/Freezing Rain
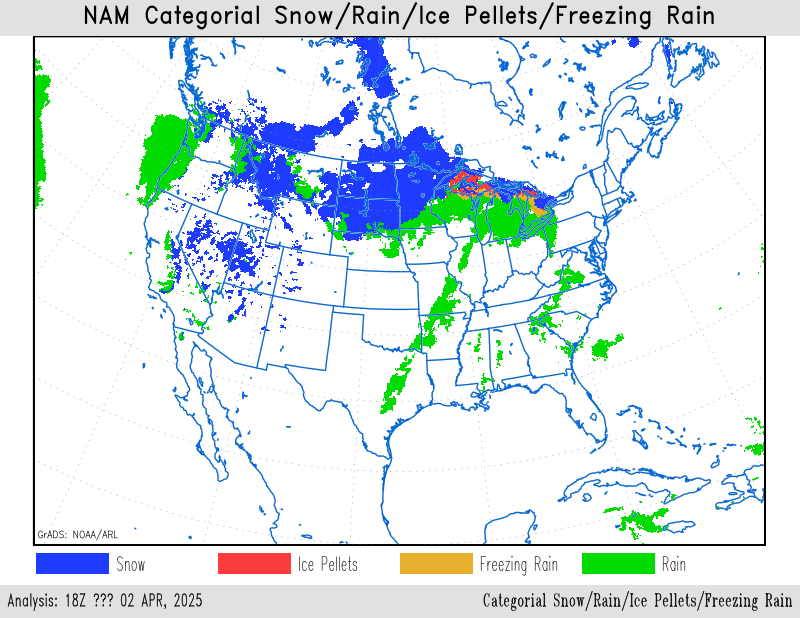
Product Description
- Precipitation type is overlaid simulated reflectivity used to describe falling precipitation type. Categorial Types inclue Snow as blue, Rain as green, Ice Pellets as red, Freezing Rain as orange.
Copyright Kyle Gillett, cmuweather.com – 2020.
The data on this page is for educational purposes and is not intended to influnce life-threatening sistuation decision making.
Data on this page is Courtesy of NOAA, grADs, NWS GRR and DTX, and Iowa State University.
For questions and comments on this page, please email us at cmuweather@gmail.com or message us through twitter, @cmuweather.
CONUS Sector – N
orth A
merican M
esoscale Forecast System – NAM – 84hr GIF Loop
NAM Total Cloud Cover (%)
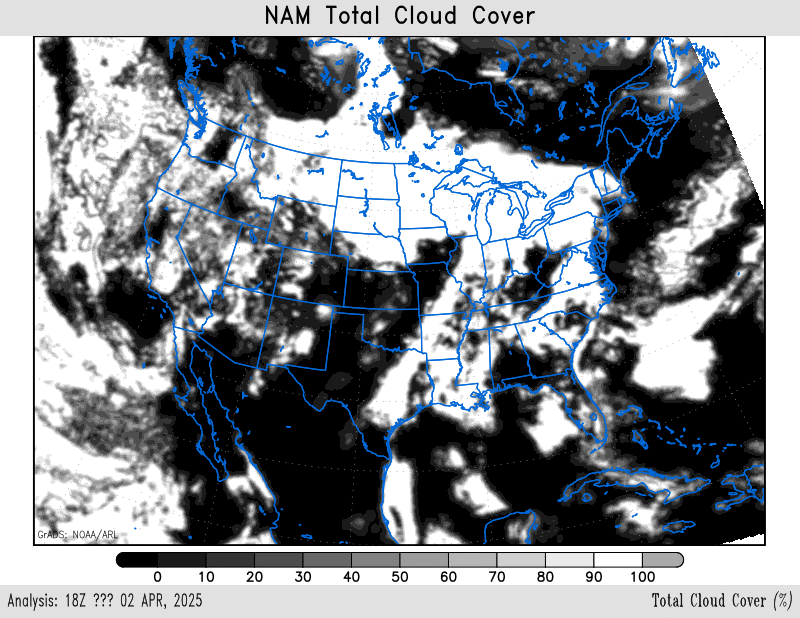
Product Description
- Simulated cloud cover expressed as white fill in pertentage (%).
Copyright Kyle Gillett, cmuweather.com – 2020.
The data on this page is for educational purposes and is not intended to influnce life-threatening sistuation decision making.
Data on this page is Courtesy of NOAA, grADs, NWS GRR and DTX, and Iowa State University.
For questions and comments on this page, please email us at cmuweather@gmail.com or message us through twitter, @cmuweather.
CONUS Sector – N
orth A
merican M
esoscale Forecast System – NAM – 84hr GIF Loop
NAM Convective Available Potential Energy (J/kg)
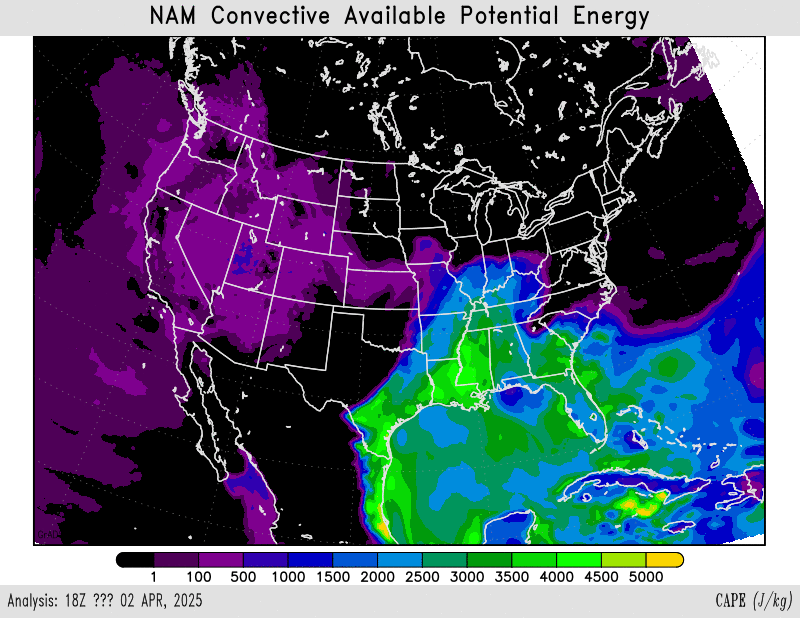
Product Description
- CAPE (Convective Available Potential Energy) is a measure of the energy of rising air parcels. The instability of the atmosphere depends upon this energy (joule per kilogram). A reference bar of values for each color (purple to yellow) is located on the bottom of the image.
Copyright Kyle Gillett, cmuweather.com – 2020.
The data on this page is for educational purposes and is not intended to influnce life-threatening sistuation decision making.
Data on this page is Courtesy of NOAA, grADs, NWS GRR and DTX, and Iowa State University.
For questions and comments on this page, please email us at cmuweather@gmail.com or message us through twitter, @cmuweather.
CONUS Sector – N
orth A
merican M
esoscale Forecast System – NAM – 84hr GIF Loop
NAM Standard Lift Index (C)
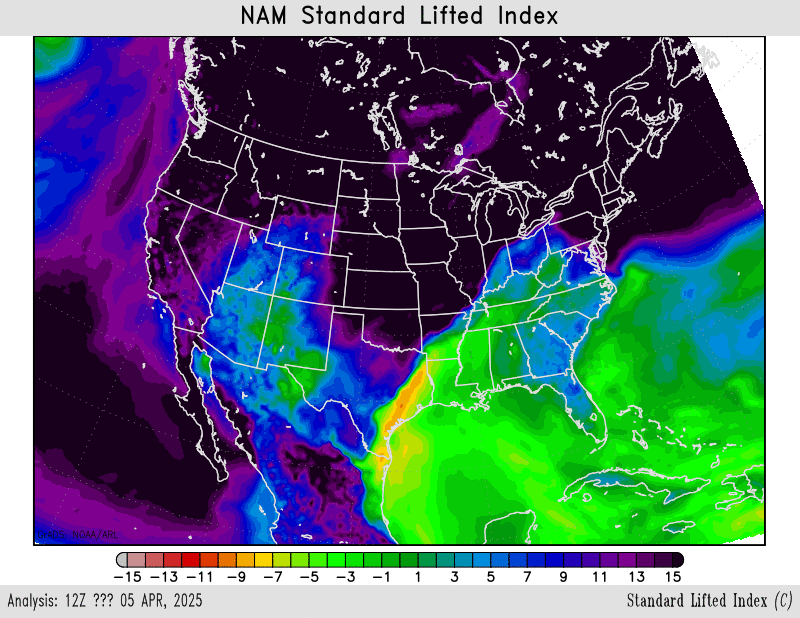
Product Description
- Lifted Index is the Lifted Index at 500-mb, based on the surface parcel, and the convective inhibition for the same parcel. These fields are meant to identify areas of surface-based CAPE and minimal convective inhibition, which suggests some threat for surface-based thunderstorms.
Copyright Kyle Gillett, cmuweather.com – 2020.
The data on this page is for educational purposes and is not intended to influnce life-threatening sistuation decision making.
Data on this page is Courtesy of NOAA, grADs, NWS GRR and DTX, and Iowa State University.
For questions and comments on this page, please email us at cmuweather@gmail.com or message us through twitter, @cmuweather.
CONUS Sector – RAP
id Refresh – RAP – 21hr GIF Loop
RAP 200mb Heights (dam), Isotachs (knt) and Wind (knt)

Product Description
- Isopleths as black lines expressing the height of the 200 mb level in decameters (dam).
- Wind magnitude in knots at 200 mb expressed as color fill. Fill begins at wind magnitude => 40 knots; color bar on the bottom of the image for wind magnitudes of 10 to 200 knots in 20 knot increments.
- Wind in knots at 200 mb expressed as wind barbs.
Copyright Kyle Gillett, cmuweather.com – 2020.
The data on this page is for educational purposes and is not intended to influnce life-threatening sistuation decision making.
Data on this page is Courtesy of NOAA, grADs, NWS GRR and DTX, and Iowa State University.
For questions and comments on this page, please email us at cmuweather@gmail.com or message us through twitter, @cmuweather.
CONUS Sector – RAP
id Refresh – RAP – 21hr GIF Loop
RAP 500mb Heights (dam) Wind (knts) and Vorticity (1e-5/sec)

Product Description
- Absolute Vorticity (10**(-5)/second) at 500 mb expressed as color fill with a color bar on the bottom of the image.
- Isopleths as black lines expressing the height of the 500 mb level in decameters (dam).
- Wind in knots at 500 mb expressed as wind barbs.
Copyright Kyle Gillett, cmuweather.com – 2020.
The data on this page is for educational purposes and is not intended to influnce life-threatening sistuation decision making.
Data on this page is Courtesy of NOAA, grADs, NWS GRR and DTX, and Iowa State University.
For questions and comments on this page, please email us at cmuweather@gmail.com or message us through twitter, @cmuweather.
CONUS Sector – RAP
id Refresh – RAP – 21hr GIF Loop
RAP 700mb Heights (dam), Vertical Velocity (mb/hr), Relative Humidity (%) and Wind (knt)

Product Description
- Relative humidity at 700 mb as a percentage. Fill begins at percentages at >= 60%.
- Isopleths as black lines expressing the height of the 700 mb level in decameters (dam).
- Wind in knots at 700 mb expressed as wind barbs.
Copyright Kyle Gillett, cmuweather.com – 2020.
The data on this page is for educational purposes and is not intended to influnce life-threatening sistuation decision making.
Data on this page is Courtesy of NOAA, grADs, NWS GRR and DTX, and Iowa State University.
For questions and comments on this page, please email us at cmuweather@gmail.com or message us through twitter, @cmuweather.
CONUS Sector – RAP
id Refresh – RAP – 21hr GIF Loop
RAP 850mb Temperature (F), Relative Humidity (%) and Wind (knt)

Product Description
- Relative humidity at 850 mb as a percentage (%). Fill begins at percentages at >= 60%.
- Isopleths as black lines expressing the height of the 850 mb level in decameters (dam).
- Isotherms as various color expressing temperature in degrees fahrenheit (F) at the 850 mb level
- Wind in knots (knt) at 850 mb expressed as wind barbs.
Copyright Kyle Gillett, cmuweather.com – 2020.
The data on this page is for educational purposes and is not intended to influnce life-threatening sistuation decision making.
Data on this page is Courtesy of NOAA, grADs, NWS GRR and DTX, and Iowa State University.
For questions and comments on this page, please email us at cmuweather@gmail.com or message us through twitter, @cmuweather.
CONUS Sector – RAP
id Refresh – RAP – 21hr GIF Loop
RAP MSLP (SLP(mb-100)), 1000-500mb Thickness (dam) and 6hr Precipitation (mm)

Product Description
- The thickness of the 1000 mb to 500 mb layer expressed in decameters (dam). Increments are 6 dam apart. For thicknesses of 546 dam and greater, these contours will be red dashed lines. For values below 546 dam the dashed lines will be in blue. The 540 dam line provides a very rough indication of possible frozen precipitation depending on surface temperature and other conditions.
- Accumulated precipitation in inches for the 6 hours preceding the forecast hour expressed as color fill for values >= 0.01. A reference bar of values for each color is located on the top right of the image.
- Isobars as black lines expressing Mean Sea Level Pressure in millibars (mb).
Copyright Kyle Gillett, cmuweather.com – 2020.
The data on this page is for educational purposes and is not intended to influnce life-threatening sistuation decision making.
Data on this page is Courtesy of NOAA, grADs, NWS GRR and DTX, and Iowa State University.
For questions and comments on this page, please email us at cmuweather@gmail.com or message us through twitter, @cmuweather.
CONUS Sector – RAP
id Refresh – RAP – 21hr GIF Loop
RAP 2m Temperature (F) and 10m Wind (knt)

Product Description
- 2m Temperature expressed as color fill for values >= -40 in degrees fahrenheit (F)
- 10m wind speeds expressed as wind barbs.
Copyright Kyle Gillett, cmuweather.com – 2020.
The data on this page is for educational purposes and is not intended to influnce life-threatening sistuation decision making.
Data on this page is Courtesy of NOAA, grADs, NWS GRR and DTX, and Iowa State University.
For questions and comments on this page, please email us at cmuweather@gmail.com or message us through twitter, @cmuweather.
CONUS Sector – RAP
id Refresh – RAP – 21hr GIF Loop
RAP Precipitation Type – Categorial Snow/Rain/Ice Pellets/Freezing Rain

Product Description
- Precipitation type is overlaid simulated reflectivity used to describe falling precipitation type. Categorial Types inclue Snow as blue, Rain as green, Ice Pellets as red, Freezing Rain as orange.
Copyright Kyle Gillett, cmuweather.com – 2020.
The data on this page is for educational purposes and is not intended to influnce life-threatening sistuation decision making.
Data on this page is Courtesy of NOAA, grADs, NWS GRR and DTX, and Iowa State University.
For questions and comments on this page, please email us at cmuweather@gmail.com or message us through twitter, @cmuweather.
CONUS Sector – RAP
id Refresh – RAP – 21hr GIF Loop
RAP Convective Available Potential Energy (J/kg)

Product Description
- CAPE (Convective Available Potential Energy) is a measure of the energy of rising air parcels. The instability of the atmosphere depends upon this energy (joule per kilogram). A reference bar of values for each color (purple to yellow) is located on the bottom of the image.
Copyright Kyle Gillett, cmuweather.com – 2020.
The data on this page is for educational purposes and is not intended to influnce life-threatening sistuation decision making.
Data on this page is Courtesy of NOAA, grADs, NWS GRR and DTX, and Iowa State University.
For questions and comments on this page, please email us at cmuweather@gmail.com or message us through twitter, @cmuweather.
CONUS Sector – RAP
id Refresh – RAP – 21hr GIF Loop
RAP Standard Lift Index (C)

Product Description
- Lifted Index is the Lifted Index at 500-mb, based on the surface parcel, and the convective inhibition for the same parcel. These fields are meant to identify areas of surface-based CAPE and minimal convective inhibition, which suggests some threat for surface-based thunderstorms.
Copyright Kyle Gillett, cmuweather.com – 2020.
The data on this page is for educational purposes and is not intended to influnce life-threatening sistuation decision making.
Data on this page is Courtesy of NOAA, grADs, NWS GRR and DTX, and Iowa State University.
For questions and comments on this page, please email us at cmuweather@gmail.com or message us through twitter, @cmuweather.
CONUS Sector – H
igh R
esolution R
apid R
efresh- HRRR – 18hr GIF Loop
HRRR 200mb Heights (dam), Isotachs (knt) and Wind (knt)
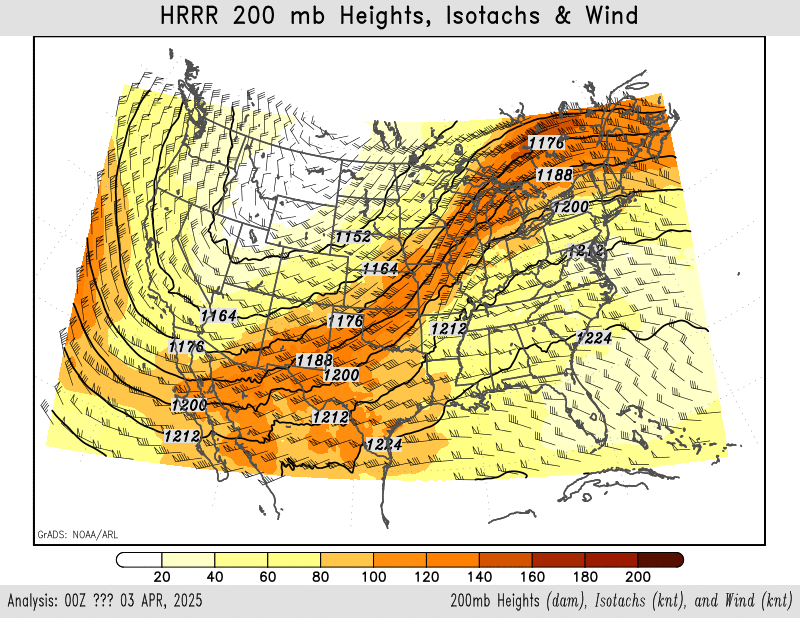
Product Description
- Isopleths as black lines expressing the height of the 200 mb level in decameters (dam).
- Wind magnitude in knots at 200 mb expressed as color fill. Fill begins at wind magnitude => 40 knots; color bar on the bottom of the image for wind magnitudes of 10 to 200 knots in 20 knot increments.
- Wind in knots at 200 mb expressed as wind barbs.
Copyright Kyle Gillett, cmuweather.com – 2020.
The data on this page is for educational purposes and is not intended to influnce life-threatening sistuation decision making.
Data on this page is Courtesy of NOAA, grADs, NWS GRR and DTX, and Iowa State University.
For questions and comments on this page, please email us at cmuweather@gmail.com or message us through twitter, @cmuweather.
CONUS Sector – H
igh R
esolution R
apid R
efresh- HRRR – 18hr GIF Loop
HRRR 500mb Heights (dam) Wind (knts) and Vorticity (1e-5/sec)
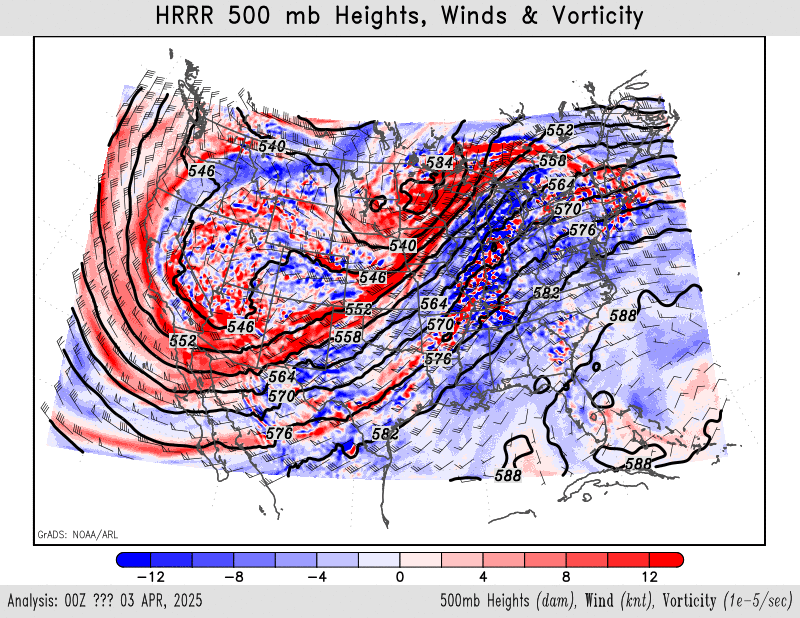
Product Description
- Absolute Vorticity (10**(-5)/second) at 500 mb expressed as color fill with a color bar on the bottom of the image.
- Isopleths as black lines expressing the height of the 500 mb level in decameters (dam).
- Wind in knots at 500 mb expressed as wind barbs.
Copyright Kyle Gillett, cmuweather.com – 2020.
The data on this page is for educational purposes and is not intended to influnce life-threatening sistuation decision making.
Data on this page is Courtesy of NOAA, grADs, NWS GRR and DTX, and Iowa State University.
For questions and comments on this page, please email us at cmuweather@gmail.com or message us through twitter, @cmuweather.
CONUS Sector – H
igh R
esolution R
apid R
efresh- HRRR – 18hr GIF Loop
HRRR 700mb Heights (dam), Vertical Velocity (mb/hr), Relative Humidity (%) and Wind (knt)
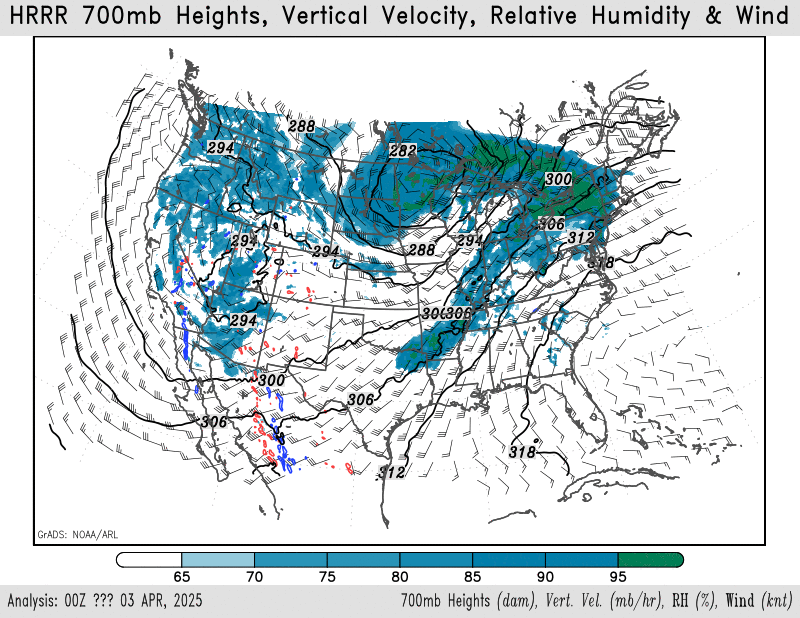
Product Description
- Relative humidity at 700 mb as a percentage. Fill begins at percentages at >= 60%.
- Isopleths as black lines expressing the height of the 700 mb level in decameters (dam).
- Wind in knots at 700 mb expressed as wind barbs.
Copyright Kyle Gillett, cmuweather.com – 2020.
The data on this page is for educational purposes and is not intended to influnce life-threatening sistuation decision making.
Data on this page is Courtesy of NOAA, grADs, NWS GRR and DTX, and Iowa State University.
For questions and comments on this page, please email us at cmuweather@gmail.com or message us through twitter, @cmuweather.
CONUS Sector – H
igh R
esolution R
apid R
efresh- HRRR – 18hr GIF Loop
HRRR 850mb Temperature (F), Relative Humidity (%) and Wind (knt)
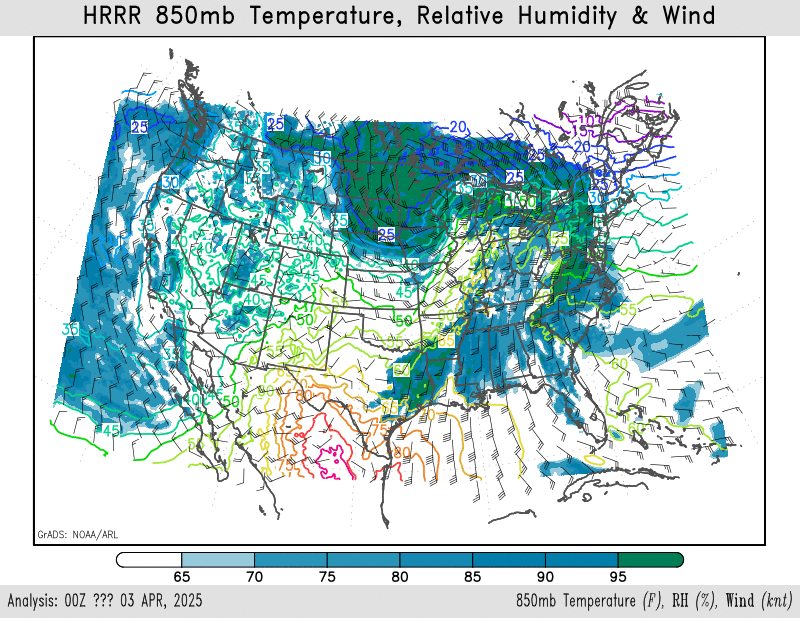
Product Description
- Relative humidity at 850 mb as a percentage (%). Fill begins at percentages at >= 60%.
- Isopleths as black lines expressing the height of the 850 mb level in decameters (dam).
- Isotherms as various color expressing temperature in degrees fahrenheit (F) at the 850 mb level
- Wind in knots (knt) at 850 mb expressed as wind barbs.
Copyright Kyle Gillett, cmuweather.com – 2020.
The data on this page is for educational purposes and is not intended to influnce life-threatening sistuation decision making.
Data on this page is Courtesy of NOAA, grADs, NWS GRR and DTX, and Iowa State University.
For questions and comments on this page, please email us at cmuweather@gmail.com or message us through twitter, @cmuweather.
CONUS Sector – H
igh R
esolution R
apid R
efresh- HRRR – 18hr GIF Loop
HRRR MSLP (SLP(mb-100)), 1000-500mb Thickness (dam) and 6hr Precipitation (mm)
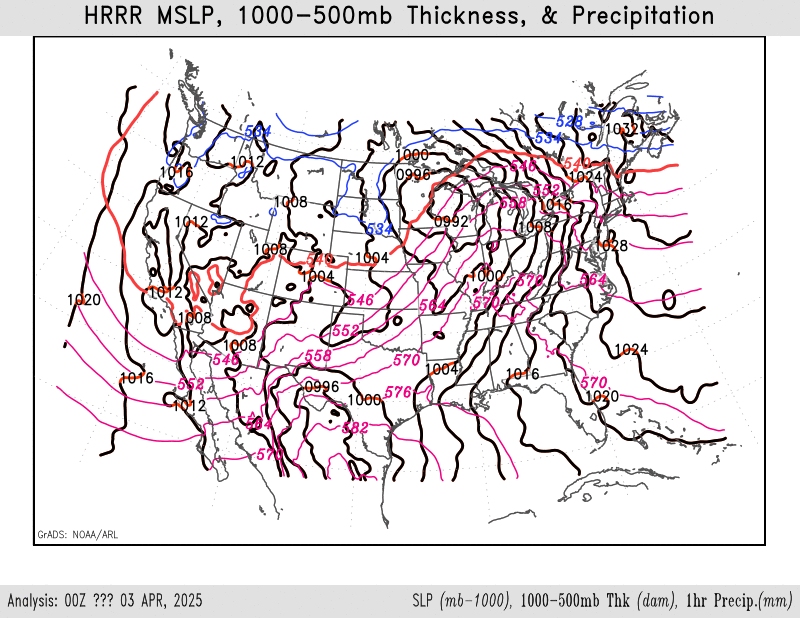
Product Description
- The thickness of the 1000 mb to 500 mb layer expressed in decameters (dam). Increments are 6 dam apart. For thicknesses of 546 dam and greater, these contours will be red dashed lines. For values below 546 dam the dashed lines will be in blue. The 540 dam line provides a very rough indication of possible frozen precipitation depending on surface temperature and other conditions.
- Accumulated precipitation in inches for the 6 hours preceding the forecast hour expressed as color fill for values >= 0.01. A reference bar of values for each color is located on the top right of the image.
- Isobars as black lines expressing Mean Sea Level Pressure in millibars (mb).
Copyright Kyle Gillett, cmuweather.com – 2020.
The data on this page is for educational purposes and is not intended to influnce life-threatening sistuation decision making.
Data on this page is Courtesy of NOAA, grADs, NWS GRR and DTX, and Iowa State University.
For questions and comments on this page, please email us at cmuweather@gmail.com or message us through twitter, @cmuweather.
CONUS Sector – H
igh R
esolution R
apid R
efresh- HRRR – 18hr GIF Loop
HRRR 2m Temperature (F) and 10m Wind (knt)
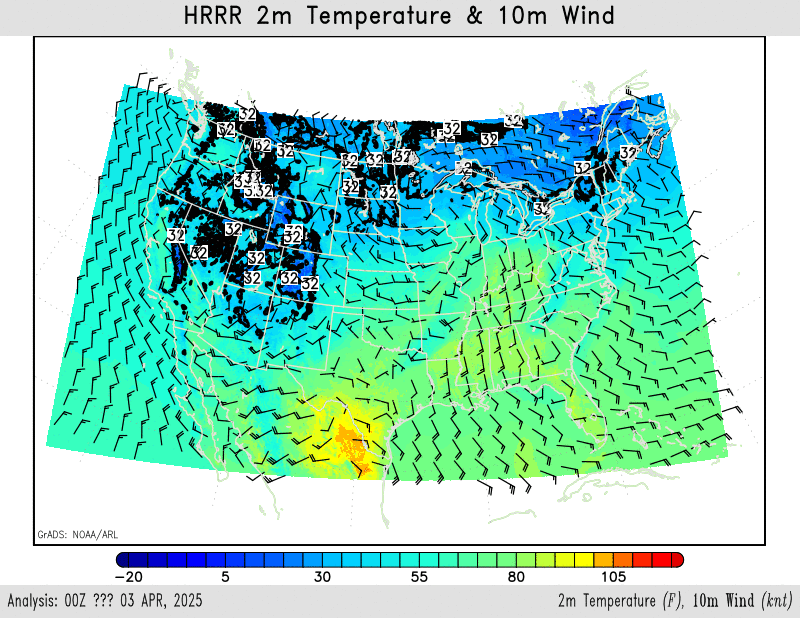
Product Description
- 2m Temperature expressed as color fill for values >= -40 in degrees fahrenheit (F)
- 10m wind speeds expressed as wind barbs.
Copyright Kyle Gillett, cmuweather.com – 2020.
The data on this page is for educational purposes and is not intended to influnce life-threatening sistuation decision making.
Data on this page is Courtesy of NOAA, grADs, NWS GRR and DTX, and Iowa State University.
For questions and comments on this page, please email us at cmuweather@gmail.com or message us through twitter, @cmuweather.
CONUS Sector – H
igh R
esolution R
apid R
efresh- HRRR – 18hr GIF Loop
HRRR Precipitation Type – Categorial Snow/Rain/Ice Pellets/Freezing Rain

Product Description
- Precipitation type is overlaid simulated reflectivity used to describe falling precipitation type. Categorial Types inclue Snow as blue, Rain as green, Ice Pellets as red, Freezing Rain as orange.
Copyright Kyle Gillett, cmuweather.com – 2020.
The data on this page is for educational purposes and is not intended to influnce life-threatening sistuation decision making.
Data on this page is Courtesy of NOAA, grADs, NWS GRR and DTX, and Iowa State University.
For questions and comments on this page, please email us at cmuweather@gmail.com or message us through twitter, @cmuweather.
CONUS Sector – H
igh R
esolution R
apid R
efresh- HRRR – 18hr GIF Loop
HRRR Convective Available Potential Energy (J/kg)
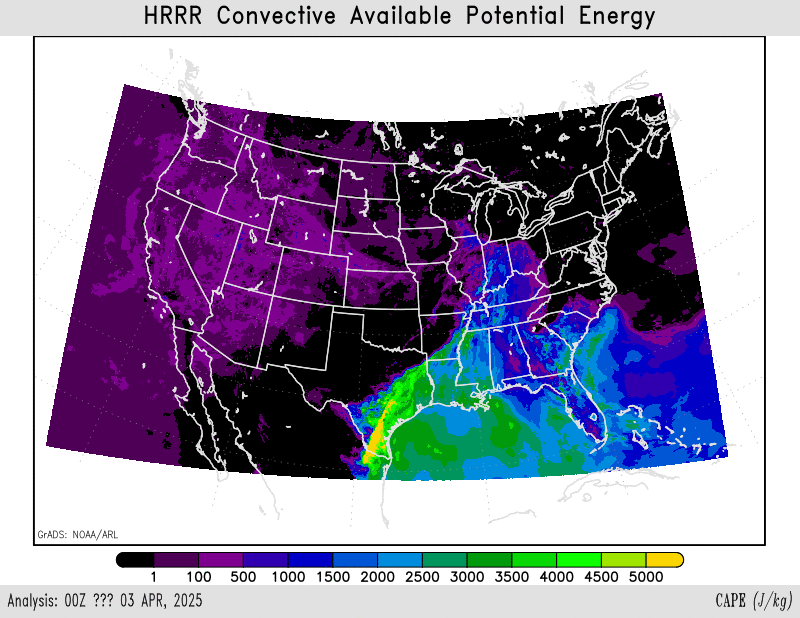
Product Description
- CAPE (Convective Available Potential Energy) is a measure of the energy of rising air parcels. The instability of the atmosphere depends upon this energy (joule per kilogram). A reference bar of values for each color (purple to yellow) is located on the bottom of the image.
Copyright Kyle Gillett, cmuweather.com – 2020.
The data on this page is for educational purposes and is not intended to influnce life-threatening sistuation decision making.
Data on this page is Courtesy of NOAA, grADs, NWS GRR and DTX, and Iowa State University.
For questions and comments on this page, please email us at cmuweather@gmail.com or message us through twitter, @cmuweather.
CONUS Sector – H
igh R
esolution R
apid R
efresh- HRRR – 18hr GIF Loop
HRRR Standard Lift Index (C)
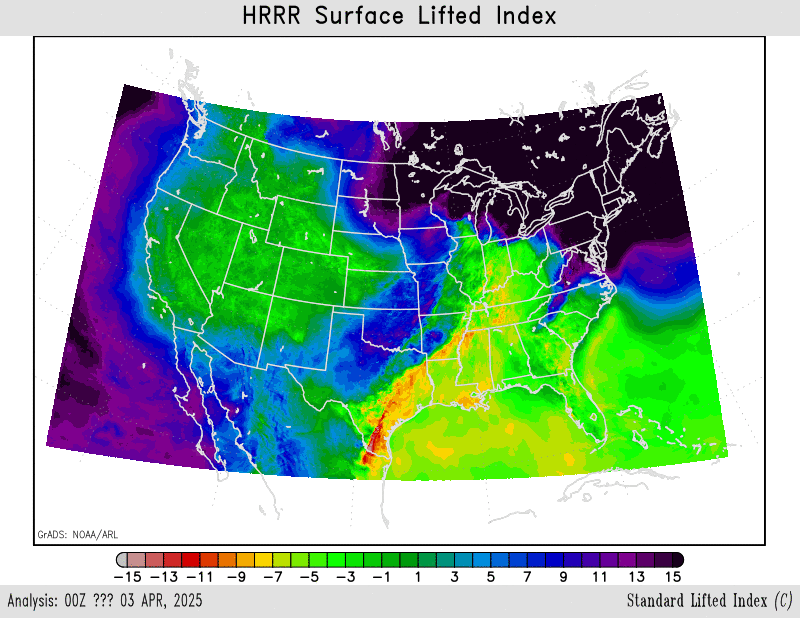
Product Description
- Lifted Index is the Lifted Index at 500-mb, based on the surface parcel, and the convective inhibition for the same parcel. These fields are meant to identify areas of surface-based CAPE and minimal convective inhibition, which suggests some threat for surface-based thunderstorms.
Copyright Kyle Gillett, cmuweather.com – 2020.
The data on this page is for educational purposes and is not intended to influnce life-threatening sistuation decision making.
Data on this page is Courtesy of NOAA, grADs, NWS GRR and DTX, and Iowa State University.
For questions and comments on this page, please email us at cmuweather@gmail.com or message us through twitter, @cmuweather.
CONUS Sector – H
igh R
esolution R
apid R
efresh- HRRR – 18hr GIF Loop
HRRR Cloud Cover (%)
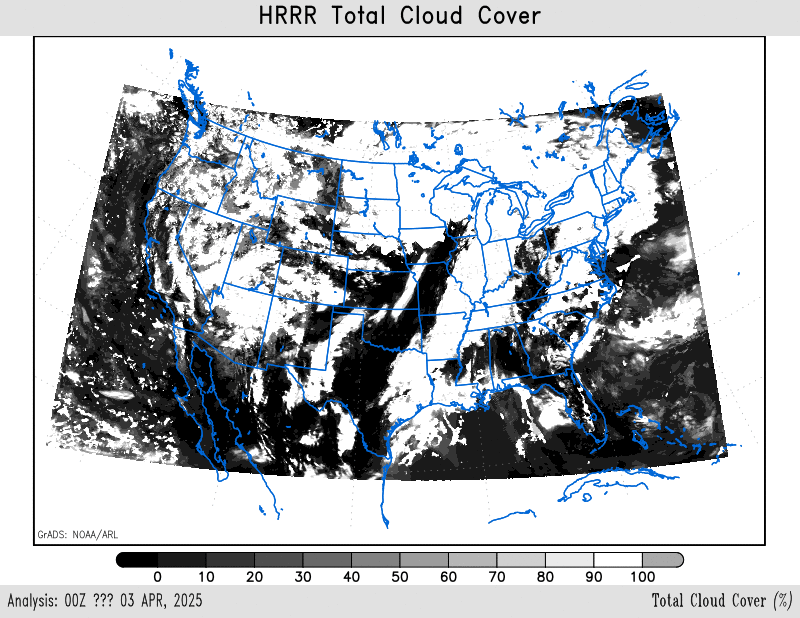
Product Description
- Simulated cloud cover expressed as white fill in pertentage (%).
Copyright Kyle Gillett, cmuweather.com – 2020.
The data on this page is for educational purposes and is not intended to influnce life-threatening sistuation decision making.
Data on this page is Courtesy of NOAA, grADs, NWS GRR and DTX, and Iowa State University.
For questions and comments on this page, please email us at cmuweather@gmail.com or message us through twitter, @cmuweather.
CONUS Sector – H
igh R
esolution R
apid R
efresh- HRRR – 18hr GIF Loop
HRRR Simulated Reflectivity (dBZ)
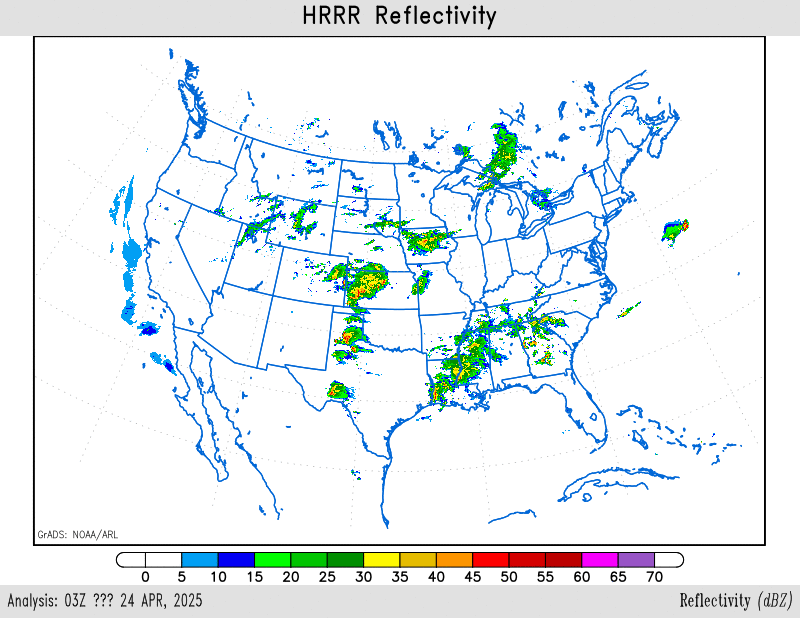
Product Description
- Simulated radar reflectivity based upon the particles of condensed water in the atmosphere, in dBZ.
Copyright Kyle Gillett, cmuweather.com – 2020.
The data on this page is for educational purposes and is not intended to influnce life-threatening sistuation decision making.
Data on this page is Courtesy of NOAA, grADs, NWS GRR and DTX, and Iowa State University.
For questions and comments on this page, please email us at cmuweather@gmail.com or message us through twitter, @cmuweather.
CONUS Sector – H
igh R
esolution R
apid R
efresh- HRRR – 18hr GIF Loop
HRRR Lightning (Max Strike Number)
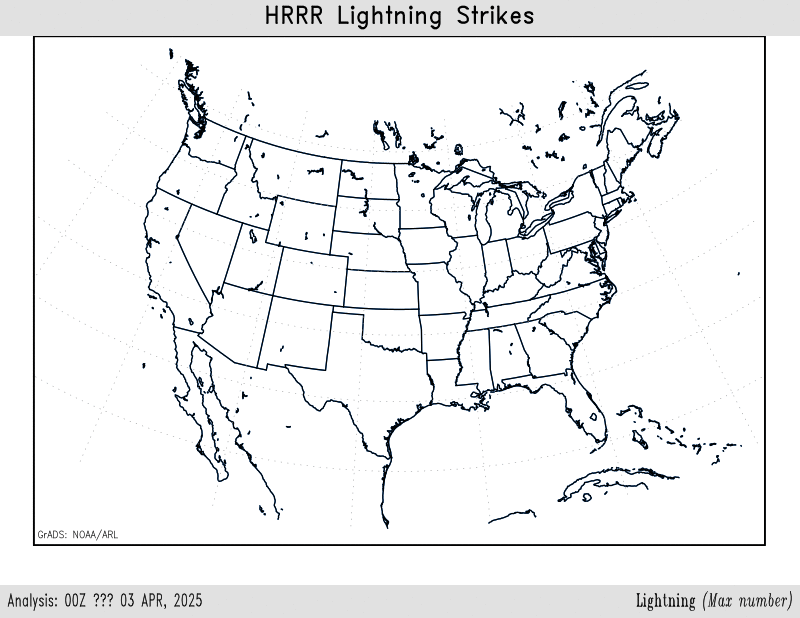
Product Description
- The rate of predicted lightning flashes expressed as the number of flashes per square kilometer over a 5 minute period – this parameter represents the maximum flash rate predicted over the previous hour. It is expressed as a color fill with a reference bar of values for each color located on the bottom of the image.